
Calculating accurate pressure from Particle Image Velocimetry (PIV) has long been a target of many fluid dynamics researchers. A reliable way of getting results could be a true scientific breakthrough. Using a non-intrusive, high resolution technique like PIV could be much better than employing complex pressure transducers with low special resolution.
In the last few years an increasing number of papers have been published on this subject and new methods of calculating pressure have been proposed and evaluated. The main idea of pressure reconstruction is to solve momentum equation to get pressure from a time-resolved PIV. Obtaining pressure distribution is based on computing the pressure gradient from the velocity data and subsequent spatial integration. In simple terms the first step is to acquire PIV velocity data to determine the acceleration from capturing 3 consecutive particle images (or 2 velocity fields). The next step is to extract the pressure gradient (acceleration) from the velocity data and lastly the actual computation of the pressure field can be performed, by spatial integration of the pressure gradient from a reference point, normally at a corner of the measurement domain.
MicroVec has implemented a software module to add determination of the pressure distribution to its PIV software. This implementation includes novel method called “Irrotational Correction on Pressure Gradient” (patent pending), which is unique and greatly improves the pressure reconstruction.
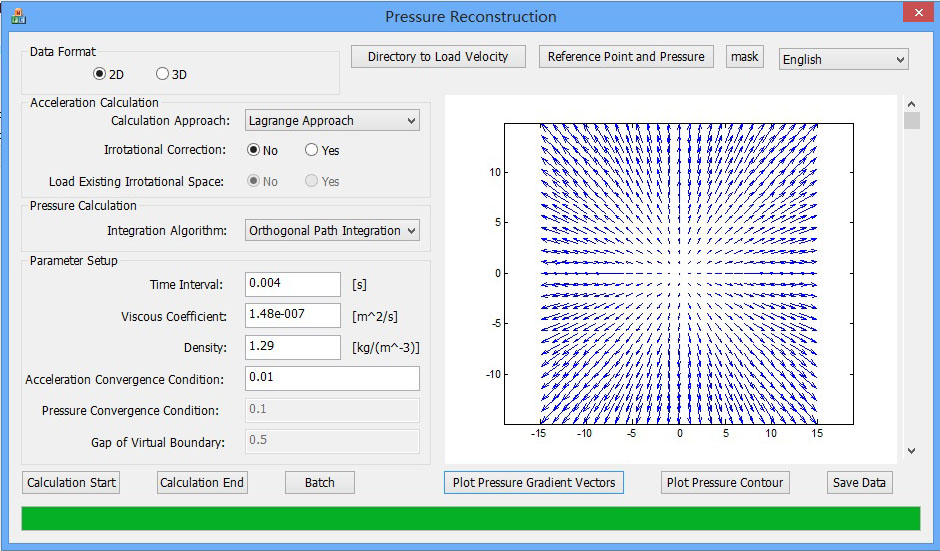
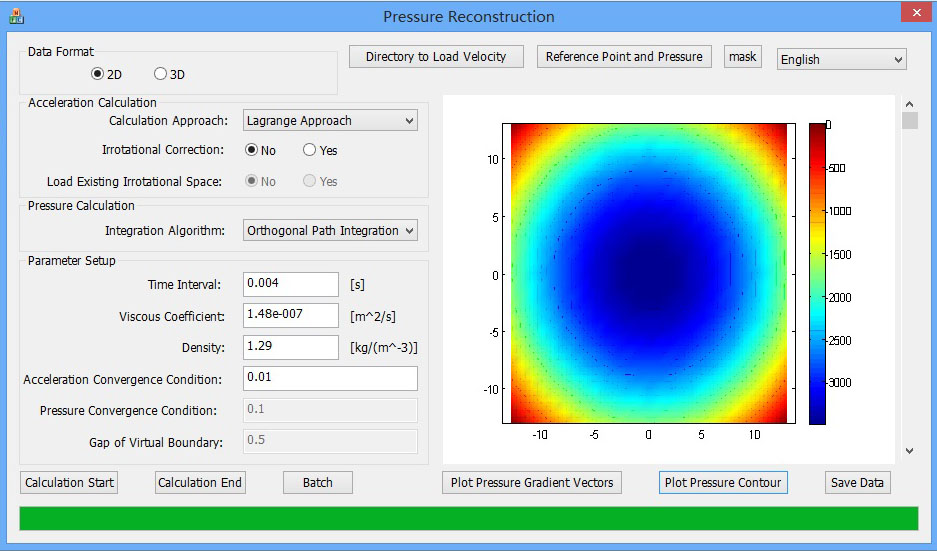
Pressure Gradient Vectors Pressure Contour
Below are two examples of velocity-pressure measurement obtained with time-resolved PIV system (2D planar PIV) from MicroVec, including DPSS laser and a CCD camera with 260 fps and VGA resolution.
Case 1: Pressure in a Wake Flow after a Cylinder.
The experiment was conducted in a water channel. The plots show a clear vortex street in a wake flow after a cylinder. Normally, a local minimum pressure appears at the center of vortex core.
Vorticity Pressure
Case 2: Determining Pressure in a Vortex Ring Impacting a Wall.
A synthetic jet flow was generated in a tank. Vortex rings were periodically pulsed to impact the wall. Flow was visualized using fluorescent dye. Quantitative measurement was performed with time-resolved PIV, which made pressure reconstruction achievable.
Flow visualization using dye Velocity field Pressure field
Pictures courtesy of Dr. Qi Gao, Beijing University of Aeronautics and Astronautics